Overview of Monitoring
What is monitoring?
To understand monitoring, let us first try an understand how is monitoring defined. Definition:
Observe and check the progress or quality of (something) over a period of time; keep under systematic review.
Lets understand the critical words from the above definition.
- Observe
- Quality
- Systemic review
The idea behind any monitoring solution is to be able to continuously observe quality parameters. Here the quality should be quantitative , i.e. it should be measurable in units. A simple example is when you have a fever, the doctors ask you to measure the temperature at a regular interval. They rely on absolute measurement over a period of time. If you had a sudden fever spike once and only once, often its considered an abberation and can be given lower priority.
Why should we monitor?
Know when something is wrong
As a site owner/ system administrator or even a user, I want to know if a particular site is not working properly. This allows people to take informed decisions and avoid bigger issues. One should be on the lookout for symtoms rather than wait for a full blown disaster.

Understand business impact
Another critical reason to monitor is often driven by the need to understand the business impact. If you are running an application, implies there is some impact. The impact could be to paying customers it could be to your shareholders or it could be to simply your or your company’s reputation.
The impact may sometimes be small like :

or it can be huge
A 63-minute Amazon outage on its “Prime” sales day in 2018 cost the company nearly $100 million (£76 million) according to an estimate```
In March 2015, a 12-hour Apple store outage cost the company $25 million.
In August 2016, a five-hour power outage in an operation center caused 2,000 cancelled flights and an estimated loss of $150 million for Delta Airlines.
In March 2019, a 14-hour outage cost facebook an estimated $90 million.
In 2013 , Google temporarily went dark for 5 minutes, causing a 40% drop in web traffic
The value of brand image can never be understated.
Find the root cause. Fast


Whenever an issue happens, the first intinct is to do everything to resolve the problem quickly. However something that is of equally importance (if not more)is being able to find the root cause of the issue. To find any root cause, we need a lot of runtime information, and that is where the continuous monitoring comes into play.
Having enough data helps us find proper root cause.
Don’t ignore the symtoms

Monitoring with Zabbix
Why Zabbix?
- Enterprise Class open sourced monitoring solution
- Well established in industry (22+ years)
- Support for Network monitoring, Server monitoring, Application monitoring , Cloud Monitoring, Services Monitoring
- Free Free Free!!!
While there are multiple commercial monitoring solutions available today, Zabbix provides an open source alternative that is ewll established. Being open source means, you can provide solutions for your own problems and with an active community support, there are multiple support base available. Finally, for many companies and individuals, spending a lot of money on monitoring (which is not their primary offerring) is not always possible. That is where it helps to have a free alternative.
Architecture
- Zabbix Server
- Zabbix Agent
- Zabbix Proxy (optional)
There are 3 primary components in the Zabbix architecture. Working on a classical server-agent model, it has an optional intermediary layer of proxies. Let us describe these components in more details.
Zabbix Server
Zabbix Server is the central process of Zabbix Software. This is the brain of the system and it performs the below functions
- Polling
- Trapping of data
- Calculate Trigger
- Send notifications to users
Stores all data in DB (Postgres or MySQL) and written in C and PHP.
Lets cover the key contepts
- Key concepts
- Hosts
- Items
- Triggers
- Actions
Host
When setting up a host there are generally 2 approaches
- Auto discovered hosts
- Manually configured hosts
While Manually configured hosts work for most deployment models, the auto discovered hosts are a necessity when it comes to Microservices and autoscaling patterns in todays cloud environment.
Generally the overall flow is as below:

Items
An item is an individual metric, used for monitoring the server. Items can have the below configurations
- Update Interval - Frequency at which we should monitor the item
- History Period - The total time for which we need to save the item in the database
- Trends Period - The total time for which we need to save the trend (value average over an hour) in the database
- Item Type
- Zabbix Agent (Passive)
- Zabbix Agent (Active)
- HTTP Agent
- SSH Agent
- JMX Agent
- Zabbix Trapper
- Dependent Items
- Log File Monitoring
Zabbix Agent
The below diagram sums the difference between a Zabbix Active and Zabbix Passive agent.

If you use the Zabbix agent in the passive mode, it means that the poller (internal server process) connects to the agent on port 10050/TCP and polls for a certain value (e.g., host CPU load). The poller waits until the agent on the host responds with the value. Then the server gets the value back, and the connection closes.
In the active mode, all data processing is performed on the agent, without the interference of pollers. However, the agent must know what metrics should be monitored, and that is why the agent connects to the trapper port 10051/TCP of the server once every two minutes (by default). The agent requests the information about the items, and then performs the monitoring on the host and pushes the data to the server via the same TCP port.
While the decision of Active vs Passive can be driven by
- Topology benefits (if incoming connections are allowed or only outgoing connections are allowed)
- Performance benefits (For quick checks Active Agent is better)
Configuration
Passive Agent
For a passive agent the configuration is more simple. It just needs the below values:
- Server - Comma separated list of IP values from which Agent will accept incoming connections

Active Agent
Active agent requires a more in-depth configuration.
- ServerActive - This is the list of IP addresses and DNS names of your Zabbix servers or proxies to which the agent will connect once every two minutes to request the configuration
- Hostname - Hostname must match the name configured in the front-end of Zabbix (case sensitive) To reduce confusion the hostname should be unique in case of Active Agents
HTTP Agent
These agents allow you to make a HTTP(S) call and receive the returned response as value. This does not require any agent to be installed on the target machine.
- The item is checked by the Zabbix Server (or Proxy)
- Has support for HTTP Authentication (Basic/Digest/NTLM)
SSH Agent
SSH Checks allow to connect to a target machine using SSH protocol and then execute a script. There are few things to take care of here:
- Support for passphrase and key based authentication
- For key based authentication save te key location to the SSHKeyLocation property
JMX Agent
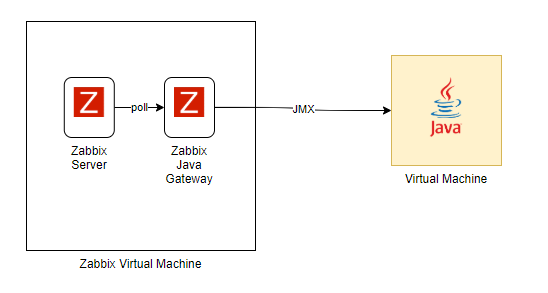
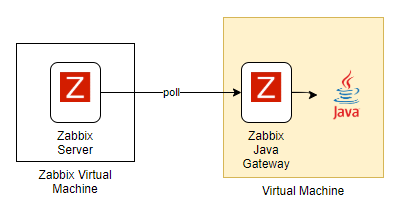
Allows JMX basedmonitoring of any running java applications. We need to install an additional Zabbix Daemon called “Zabbix Java Gateway”. The flow of control goes as below:
Option#1

Option#2

Some important points to consider:
On Zabbix Server:
- JavaGateway - The IP on which the Java Gateway is available
- StartJavaPoller - The number of pollers used to poll the JMX API
On the Item:
- IP and Port of the JMX Endpoint
- Authentication (if required)
- JMX Endpoint(eg. jmx[com.example:Type=Hello,apple.weight])
Zabbix Trapper
Most of the monitoring in Zabbix is based on pull/poll based monitoring. In most cases the central server polls the agent and the agent/gateway in turn polls the component. The Zabbix Trapper provides a “push” based model.
The easiest way to push data is using the “zabbix_sender” tool which can be installed.
zabbix_sender -z <server IP address> -p 10051 -s "New host" -k trap -o "test value"
Dependent Items
There are situations when one item gathers multiple metrics at a time or it even makes more sense to collect related metrics simultaneously, for example:
CPU utilization of individual cores Incoming/outgoing/total network traffic To allow for bulk metric collection and simultaneous use in several related items, Zabbix supports dependent items. Dependent items depend on the master item that collects their data simultaneously, in one query. A new value for the master item automatically populates the values of the dependent items. Dependent items cannot have a different update interval than the master item.
Zabbix preprocessing options can be used to extract the part that is needed for the dependent item from the master item data.
Log File Monitoring
Zabbix can be used for centralized monitoring and analysis of log files with/without log rotation support. Notifications can be used to warn users when a log file contains certain strings or string patterns.
To monitor a log file you must have:
- Zabbix agent running on the host
- log monitoring item set up
A log files requires an Zabbix Active Agent. Hence all configuration must match that of an Active Agent.
Triggers
Triggers help evaluate if a particular item value falls within the acceptable range (OK) or unacceptale range (PROBLEM). Triggers are recalculated everytime a value (item) is received from the server.
Triggers can be evaluated using functions like
| Function | Description |
|---|---|
| nodata | If there is no data from the server |
| last(#n) | Check the nth last value for an item |
| avg(#n) | Check the average value over the last n items |
| max(#n) | The maximum value over the last n items |
| min(#n) | The minimum value over the last n items |
| and others |
Actions
Actions allow to take action on an event. There are several types of events generated in Zabbix:
- trigger events - whenever a trigger changes its status (OK→PROBLEM→OK)
- discovery events - when hosts or services are detected
- auto registration events - when active agents are auto-registered by server
- internal events - when an item/low-level discovery rule becomes unsupported or a trigger goes into an unknown state
Different action can be taken based on the event. Some examples are as below:
- Trigger Events - We can send out notifications (mail/script)
- Discovery Events - Register Items
- AutoRegistration - Create Host and Register Items
- Internal Events - Send notification / Alarm
The action is completely driven by your business needs.