Performance Issue - what and why
In the previous blog we had discussed some common identifiers of performance issues. In this post we will look at some advanced issues and challenges we face when facing slowness.
Thread Consumption Analysis
While multi threaded applications are always a challenge, sometimes we need to identify the consumption of CPU / Memory at a thread level. This is very helpful when viewed in conjunction with a stack trace. To understand this better let us run a sample program.
Thread1.java:

package org.example;

import java.util.Random;

public class Thread1 implements Runnable{
    @Override
    public void run() {

        try {
            Thread.sleep(500* new Random().nextInt(5));

            final int NUM_TESTS = 1000;
            long start = System.nanoTime();
            for (int i = 0; i < NUM_TESTS; i++) {
                spin(500);
            }
            System.out.println("Took " + (System.nanoTime()-start)/1000000 +
                    "ms (expected " + (NUM_TESTS*500) + ")");

            System.out.println("ENds");

            Thread.sleep(1000);
            Thread.sleep(1000);
            Thread.sleep(1000);
            Thread.sleep(1000);

        }catch (Exception ex){

        }

    }

    private static void spin(int milliseconds) {
        long sleepTime = milliseconds*1000000L; // convert to nanoseconds
        long startTime = System.nanoTime();
        while ((System.nanoTime() - startTime) < sleepTime) {}
    }

}
When we run the above program, we can get the CPU utilization for the above process via the below command:
Command
$ ps -p <pid> -o %cpu,%mem,pid,cmd
Output
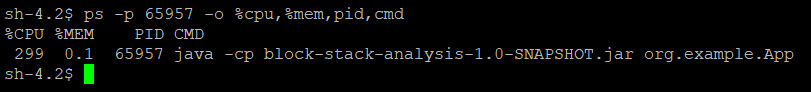
The above output is a process level consumption. If you want to know which thread is a culprit, the best way is to run the below commands:
$ jstack -l 67659
Output
Full thread dump OpenJDK 64-Bit Server VM (11.0.4+11 mixed mode):

Threads class SMR info:
_java_thread_list=0x00007fb154002890, length=13, elements={
0x00007fb1b0010000, 0x00007fb1b0240000, 0x00007fb1b0244000, 0x00007fb1b0256800,
0x00007fb1b0259000, 0x00007fb1b025b000, 0x00007fb1b025d000, 0x00007fb1b02eb000,
0x00007fb1b02ff000, 0x00007fb1b033d000, 0x00007fb1b033e800, 0x00007fb1b0340800,
0x00007fb154001000
}

"main" #1 prio=5 os_prio=0 cpu=73.45ms elapsed=337.13s tid=0x00007fb1b0010000 nid=0x10f28 waiting on condition  [0x00007fb1b929d000]
   java.lang.Thread.State: TIMED_WAITING (sleeping)
        at java.lang.Thread.sleep(java.base@11.0.4/Native Method)
        at org.example.App.main(App.java:19)

   Locked ownable synchronizers:
        - None

"Reference Handler" #2 daemon prio=10 os_prio=0 cpu=0.15ms elapsed=337.11s tid=0x00007fb1b0240000 nid=0x10f2f waiting on condition  [0x00007fb19844a000]
   java.lang.Thread.State: RUNNABLE
        at java.lang.ref.Reference.waitForReferencePendingList(java.base@11.0.4/Native Method)
        at java.lang.ref.Reference.processPendingReferences(java.base@11.0.4/Reference.java:241)
        at java.lang.ref.Reference$ReferenceHandler.run(java.base@11.0.4/Reference.java:213)

   Locked ownable synchronizers:
        - None

"Finalizer" #3 daemon prio=8 os_prio=0 cpu=0.26ms elapsed=337.11s tid=0x00007fb1b0244000 nid=0x10f30 in Object.wait()  [0x00007fb198349000]
   java.lang.Thread.State: WAITING (on object monitor)
        at java.lang.Object.wait(java.base@11.0.4/Native Method)
        - waiting on <0x000000062b608f88> (a java.lang.ref.ReferenceQueue$Lock)
        at java.lang.ref.ReferenceQueue.remove(java.base@11.0.4/ReferenceQueue.java:155)
        - waiting to re-lock in wait() <0x000000062b608f88> (a java.lang.ref.ReferenceQueue$Lock)
        at java.lang.ref.ReferenceQueue.remove(java.base@11.0.4/ReferenceQueue.java:176)
        at java.lang.ref.Finalizer$FinalizerThread.run(java.base@11.0.4/Finalizer.java:170)

   Locked ownable synchronizers:
        - None

"Signal Dispatcher" #4 daemon prio=9 os_prio=0 cpu=0.31ms elapsed=337.11s tid=0x00007fb1b0256800 nid=0x10f31 runnable  [0x0000000000000000]
   java.lang.Thread.State: RUNNABLE

   Locked ownable synchronizers:
        - None

"C2 CompilerThread0" #5 daemon prio=9 os_prio=0 cpu=13.98ms elapsed=337.11s tid=0x00007fb1b0259000 nid=0x10f32 waiting on condition  [0x0000000000000000]
   java.lang.Thread.State: RUNNABLE
   No compile task

   Locked ownable synchronizers:
        - None

"C1 CompilerThread0" #7 daemon prio=9 os_prio=0 cpu=20.30ms elapsed=337.11s tid=0x00007fb1b025b000 nid=0x10f33 waiting on condition  [0x0000000000000000]
   java.lang.Thread.State: RUNNABLE
   No compile task

   Locked ownable synchronizers:
        - None

"Sweeper thread" #8 daemon prio=9 os_prio=0 cpu=0.55ms elapsed=337.11s tid=0x00007fb1b025d000 nid=0x10f34 runnable  [0x0000000000000000]
   java.lang.Thread.State: RUNNABLE

   Locked ownable synchronizers:
        - None

"Service Thread" #9 daemon prio=9 os_prio=0 cpu=0.23ms elapsed=337.08s tid=0x00007fb1b02eb000 nid=0x10f35 runnable  [0x0000000000000000]
   java.lang.Thread.State: RUNNABLE

   Locked ownable synchronizers:
        - None

"Common-Cleaner" #10 daemon prio=8 os_prio=0 cpu=0.49ms elapsed=337.08s tid=0x00007fb1b02ff000 nid=0x10f37 in Object.wait()  [0x00007fb1802dd000]
   java.lang.Thread.State: TIMED_WAITING (on object monitor)
        at java.lang.Object.wait(java.base@11.0.4/Native Method)
        - waiting on <0x000000062b787a08> (a java.lang.ref.ReferenceQueue$Lock)
        at java.lang.ref.ReferenceQueue.remove(java.base@11.0.4/ReferenceQueue.java:155)
        - waiting to re-lock in wait() <0x000000062b787a08> (a java.lang.ref.ReferenceQueue$Lock)
        at jdk.internal.ref.CleanerImpl.run(java.base@11.0.4/CleanerImpl.java:148)
        at java.lang.Thread.run(java.base@11.0.4/Thread.java:834)
        at jdk.internal.misc.InnocuousThread.run(java.base@11.0.4/InnocuousThread.java:134)

   Locked ownable synchronizers:
        - None

"Thread-0" #11 prio=5 os_prio=0 cpu=336684.38ms elapsed=337.06s tid=0x00007fb1b033d000 nid=0x10f38 runnable  [0x00007fb1801db000]
   java.lang.Thread.State: RUNNABLE
        at org.example.Thread1.spin(Thread1.java:38)
        at org.example.Thread1.run(Thread1.java:17)
        at java.lang.Thread.run(java.base@11.0.4/Thread.java:834)

   Locked ownable synchronizers:
        - None

"Thread-1" #12 prio=5 os_prio=0 cpu=335286.95ms elapsed=337.06s tid=0x00007fb1b033e800 nid=0x10f39 runnable  [0x00007fb1733d4000]
   java.lang.Thread.State: RUNNABLE
        at org.example.Thread1.spin(Thread1.java:38)
        at org.example.Thread1.run(Thread1.java:17)
        at java.lang.Thread.run(java.base@11.0.4/Thread.java:834)

   Locked ownable synchronizers:
        - None

"Thread-2" #13 prio=5 os_prio=0 cpu=334820.84ms elapsed=337.06s tid=0x00007fb1b0340800 nid=0x10f3a runnable  [0x00007fb1732d3000]
   java.lang.Thread.State: RUNNABLE
        at org.example.Thread1.spin(Thread1.java:38)
        at org.example.Thread1.run(Thread1.java:17)
        at java.lang.Thread.run(java.base@11.0.4/Thread.java:834)

   Locked ownable synchronizers:
        - None

"Attach Listener" #14 daemon prio=9 os_prio=0 cpu=0.32ms elapsed=0.09s tid=0x00007fb154001000 nid=0x1132d waiting on condition  [0x0000000000000000]
   java.lang.Thread.State: RUNNABLE

   Locked ownable synchronizers:
        - None

"VM Thread" os_prio=0 cpu=45.91ms elapsed=337.12s tid=0x00007fb1b0238000 nid=0x10f2e runnable

"GC Thread#0" os_prio=0 cpu=13.72ms elapsed=337.13s tid=0x00007fb1b0026000 nid=0x10f29 runnable

"G1 Main Marker" os_prio=0 cpu=0.29ms elapsed=337.13s tid=0x00007fb1b0060000 nid=0x10f2a runnable

"G1 Conc#0" os_prio=0 cpu=0.02ms elapsed=337.13s tid=0x00007fb1b0062000 nid=0x10f2b runnable

"G1 Refine#0" os_prio=0 cpu=0.15ms elapsed=337.13s tid=0x00007fb1b01d3000 nid=0x10f2c runnable

"G1 Young RemSet Sampling" os_prio=0 cpu=46.23ms elapsed=337.13s tid=0x00007fb1b01d4800 nid=0x10f2d runnable
"VM Periodic Task Thread" os_prio=0 cpu=165.21ms elapsed=337.08s tid=0x00007fb1b02ed800 nid=0x10f36 waiting on condition

JNI global refs: 8, weak refs: 0
To find which thread in the above trace is consuming maximum CPU:
top -n 1 -H -p [PID}
Output
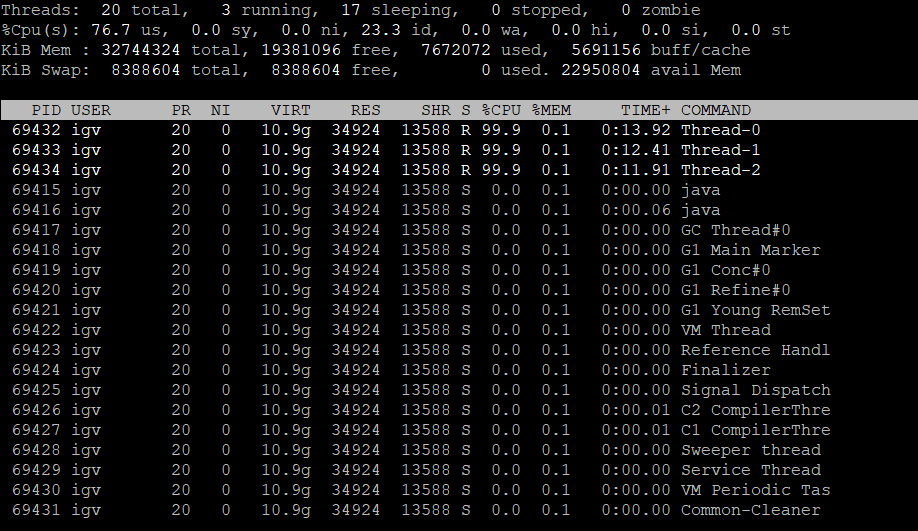
While the Thread name can act as a decent matching factor, however a more precise matching logic can be performed by the below logic: Thread nid = PID in hex For Example:
0x10f38 in decimal = 69432
SAR Report - For System wide information
Another way to fetch detailed information around system information for a linux box is through the SAR (System Activity Report) .
sar -P ALL 10 > sar.dat
SAR provides detailed information about the machine for the below parameters:
- CPU Usage Details
- Memory Usage Details
- File System Details
- Block Device Details
- Run Queue Length and Load Average
- CPU Usage for a Specific Core
- Network Interface Details
- Process, Kernel Thread, I-node, and File Table Details
- Messages, Semaphores, and Process Details
- Swapping Statistics
- I/O Operation Details
- Context Switching, Process Creation, and Swap Details
- Paging Statistics