Performance Issue - what and why
There is nothing more daunting and interesting than issues related to performance. While we pay a lot of “undue attention” to performance in code reviews, “Don’t use a Linked List, use an Array List or use a Linked List not an Array List”, we often miss the bigger picture. Most performance issues don’t come from usage of type of list or types of for loops, they actually come from the most interesting and tricky parts of code. It could be a thread which is resulting in a deadlock due to a behavior in HashMap, it could be a very poorly written SQL query that when subjected to production loads is taking exceptionally high time, or even the more common suspects of Garbage Collector (GC).
The challenge with such issues are no expert code reviewer can actually identify such issues by walking through the code. Albeit I am sure there are multiple people who love to claim of an exception to the rule. The real challenge is, when presented with a problem such as this, is when the issue is
- Sporadic
- Indeterministic
- Happens only on production or UAT
How can we actually find the root cause of such issues without relying on some expensive tool or mere guess work.
Restart and it works
How many times have we encountered issues which can be solved by a simple restart. While a restart is a short term workaround, with that 1 restart we losse credible information. Before we restart (either the machine or the process) we must make it a point to capture some additional metrics Some critical things to capture
- CPU Utilization
- Memory utilization
- JVM Metrics
- Log files
These are explained is more details below
CPU Metrics
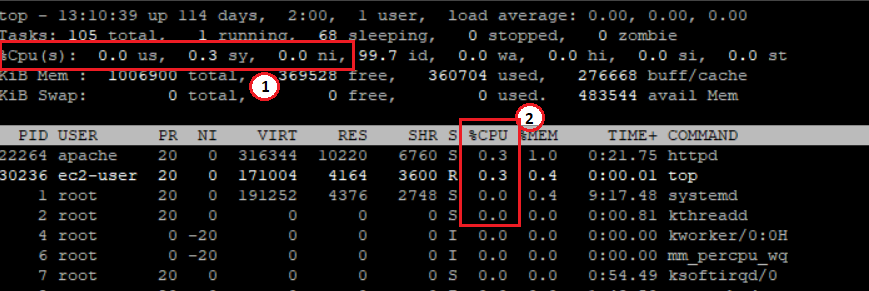
The first thing to observe is the CPU utilization at a machine and process level. The easiest way to capture them is through the top command.
Command:
$ top -o +%CPU
Output

Some points to consider:
- Total CPU Utilization - This gives a good indicator if the slowness is due to CPU starvation. This value can go upto 100%*[no of cores].
- Top CPU hogging process. This is a good indicator to find the culprit. Sometimes this could be your own app. Sometmes it could be another app eating away at crucial resources and starving your app from CPU.
Memory Metrics
The next thing we need to capture is the memory utilization at a machine and process level. The easiest way to capture them is through the same top command.
Command:
$ top -o +%MEM
Output

Some points to consider:
- Total memory utilization - This gives a good indicator if the slowness is due to low memory availability. The classical symptopms will include low “KiB Mem” and high usage of “KiB Swap”. If the system has is using a lot of swap memory, a lot of the resources will be used in swapping data in and out of the page memory.
- Top memory hogging process. - Like the CPU, this is a good indicator to find the culprit process. The next step of action would depend on if the process isyour own app or a stray app.
JVM Metrics
While CPU and Memory are good indicators to the problematic process, the probability that the problem lies with your own process is quite high. In such cases, the next logical step is to identify what within your process is eating the memory. The first step to do that is capture Jvm Metrics
Command:
$ jstat -gc <process pid>
The process pid should be the PID of the JAVA process for which we want to capture GC statistics
Output
Timestamp	S0C	S1C	S0U	S1U	EC	EU	OC	OU	PC	PU	YGC	YGCT	FGC	FGCT	GCT
944.3	40960	40960	0	27322.2	617472	276759.8	324096	273346.9	120320	110437.9	69	2.058	3	0.783	2.841
Using the above data you can arrive at a few important considerations:
- Total Garbage Collections - FGC Value
- Total Heap Used - S0U + EU + OU + PU
If you see a very high value of FGC or a trend of increasing FGC its a direct indicator that there is a problem with too much Garbage collection indicating either a memory leak or less allocated memory.
The total heap used will also give a good indicator towards the same.
Log Files
The most important indicator of any application issue is the log file. You should keep an eye out for some standard issues like
- Out of Memory Error
- Stack Overflow Error
- Out of connection error
- Too many open files error The above list is by no measure exhaustive. However this is a good starting point to identify the issue. In subsequent articles we will try to discuss other issues that we encounter and how to move forward on the same.